
Tally
TALLY — *what happened, how often?*
Press play to listen along. The line being read lights up as you go.
Show full transcript
Loading transcript…

Tally was a person of small, precise movements. Her hair, the color of warm cream, was always pulled back in a neat braid. She carried a canvas bag adorned with a tiny, iridescent charm, like a magpie’s prize. Inside, tucked between textbooks and a well-worn pencil case, lived her most important tools: a small tally-sheet and a frequency-tracker. Tally wasn’t just a student. She was a counter of outcomes, a quiet observer of the world’s patterns.
Today, Mr. Harrison’s science class buzzed with a different kind of energy. The air smelled faintly of dry-erase markers and anticipation. On each desk sat a simple plastic spinner, divided into four equal sections: red, blue, green, and yellow.
“Alright, class,” Mr. Harrison announced, his voice cheerful. “Today, we’re diving into probability. Who can tell me what probability means?”
Hands shot up. “Chances!” said Leo, a boy with perpetually messy hair.
“Likelihood!” offered Maya, always quick with the right word.
Mr. Harrison nodded. “Exactly. The chance something will happen. Now, look at your spinners. If you spin it twenty times, how many times do you expect it to land on red?”
A chorus of "Five!" echoed through the room.
“Good,” Mr. Harrison said, smiling. “That’s our hypothesis. Now, for the experiment. Each of you will spin your spinner twenty times. Record your results. Let’s see what happens.”
Most students grabbed their notebooks and started spinning, scribbling down “R, B, G, Y” as fast as they could. The spinners whirred, clicked, and clattered. Some kids cheered when their color came up. Others groaned when it didn’t.
Tally, however, worked differently. Her movements were deliberate, almost ritualistic. She didn’t just write letters. On a fresh sheet from her tally-pad, she drew a neat table with four rows, one for each color. As the spinner landed, she made a small, vertical stroke – a *tally mark – in the correct row. Every fifth mark crossed the previous four, creating a neat bundle. She worked with focused intensity, her brow slightly furrowed. She wasn't just recording; she was building a visual record of frequency counting*.
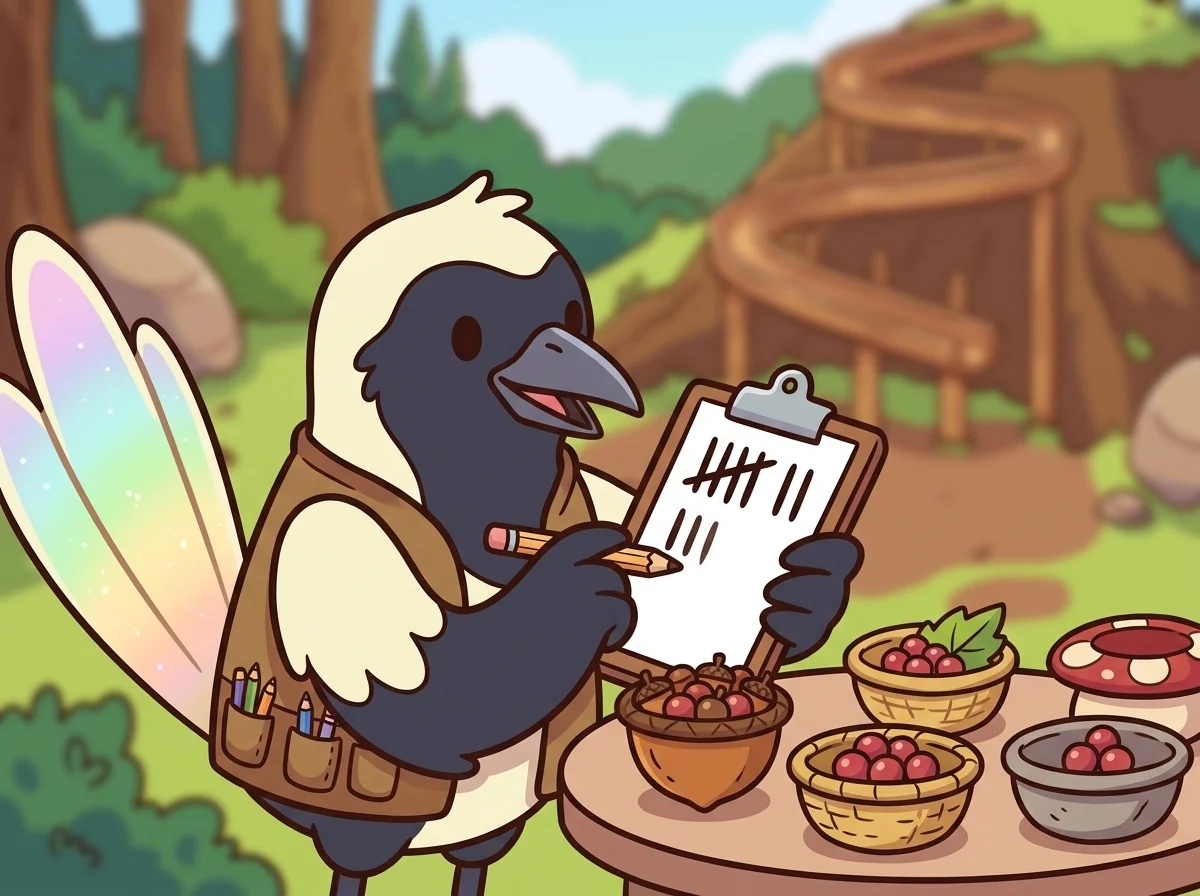
"What happened, how often?" she murmured to herself, a quiet mantra. This was her core question.
After a few minutes, the spinning stopped. Twenty trials were complete. A buzz of chatter filled the room.
“Mine landed on blue nine times!” exclaimed Sarah, looking surprised. “I thought it would be five!”
Leo threw his hands up. “This spinner is rigged! Green landed on mine eight times! And red only twice!”
Mr. Harrison walked around, looking at the various, often messy, recordings. “Interesting results, everyone. It seems our expected outcome of five reds didn’t always match what actually happened. Tally, would you mind sharing your data?”
Tally walked to the front, her tally-sheet held carefully. Her table was a model of clarity.
| Color | Tally Marks | Count | | :----- | :---------- | :---- | | Red | ||| | 3 | | Blue | |||| || | 7 | | Green | |||| ||| | 8 | | Yellow | |||| | 4 |
“My spinner landed on red three times,” she stated, her voice soft but clear. “Blue seven times. Green eight times. And yellow four times.”
Mr. Harrison pointed to the “Count” column. “These are Tally’s *absolute frequencies*. They tell us exactly how many times each color appeared. Now, who can tell us what fraction of Tally’s spins landed on red?”
Maya quickly answered, “Three out of twenty!”
“Excellent, Maya,” Mr. Harrison said. “That fraction, three-twentieths, is what we call the *relative frequency*. It’s the absolute frequency divided by the total number of trials. So, Tally’s spinner landed on red 15% of the time.” He wrote 3/20 = 0.15 on the board. “And what about Green, Leo?”
Leo grumbled, “Eight out of twenty.”
“Which is forty percent,” Mr. Harrison finished, writing 8/20 = 0.40. “Now, Leo, you said your spinner was rigged because Green came up so often. Does Tally’s data mean Green is more likely to come up on the next spin?”
Leo looked thoughtful. “I guess so? If it happened a lot, it’ll keep happening, right?”
Tally shook her head slightly. “Not exactly,” she said. “Probability isn’t about predicting the next single spin. The spinner itself is designed to have equal chances for each color.” She pointed to the spinner. “Twenty spins is a small number. If we did this a hundred times, or a thousand times, the relative frequencies would get much closer to twenty-five percent for each color.”
Mr. Harrison smiled at Tally. “That’s a crucial point, Tally. What Tally is showing us is that probability is about understanding the design of the system and the patterns that emerge over many, many trials. It’s not about guessing what will happen next, or about ‘luck’ or a ‘rigged’ game. It’s about careful observation and understanding the numbers.”
He continued, “Think of it like designing a game, or even predicting sports outcomes. You don’t just feel what’s going to happen. You look at the data. You count *what happened, and how often. That careful counting, that frequency counting*, is the very first step in understanding anything statistical.”
Tally nodded, a small, satisfied expression on her face. Her method had shown them the truth. Without her careful tally marks and organized table, all the other numbers would have been just a jumble, easy to misunderstand or dismiss as mere luck. But with her precise accounting, the story of the spinner, even in just twenty spins, began to make sense. It was the first move of every statistical investigation: count first, interpret second.
The ChanceForge ensemble
Tally is part of ChanceForge's distributed-narrative cast. Each character embodies a different curricular primitive; together they teach the full subject.
-

Display the Picture-Maker
Graphs and visual displays (bar charts, histograms, dot plots, line graphs — turning numbers into pictures)
-

Center the Middle-Finder
Central tendency — mean, median, mode (the "what's typical?" question)
-

Sample the Estimator
Sampling, sampling distributions, inference from sample to population
-

Tree the Compound-Brancher
Compound events and probability trees — multiplication rule for independent events, addition for disjoint, conditional dependencies
-

Odds the Likelihood-Reader
Basic probability — placing a chance on the 0-to-1 scale from impossible to certain
-

Scatter the Spread-Reader
Spread and variability — how far apart the data is (range), not just the middle
-

Flipside the Other-Outcome-Counter
The complement rule — find the chance it doesn't happen and subtract from 1
-

Clew the Clue-Follower
Conditional probability — how chances change once you learn a new fact
-
Evens the Long-Run-Settler
Expected value and the long run — results settle toward the average over many tries