
Display
DISPLAY — *turn numbers into pictures. the right picture reveals the pattern.*
Press play to listen along. The line being read lights up as you go.
Show full transcript
Loading transcript…
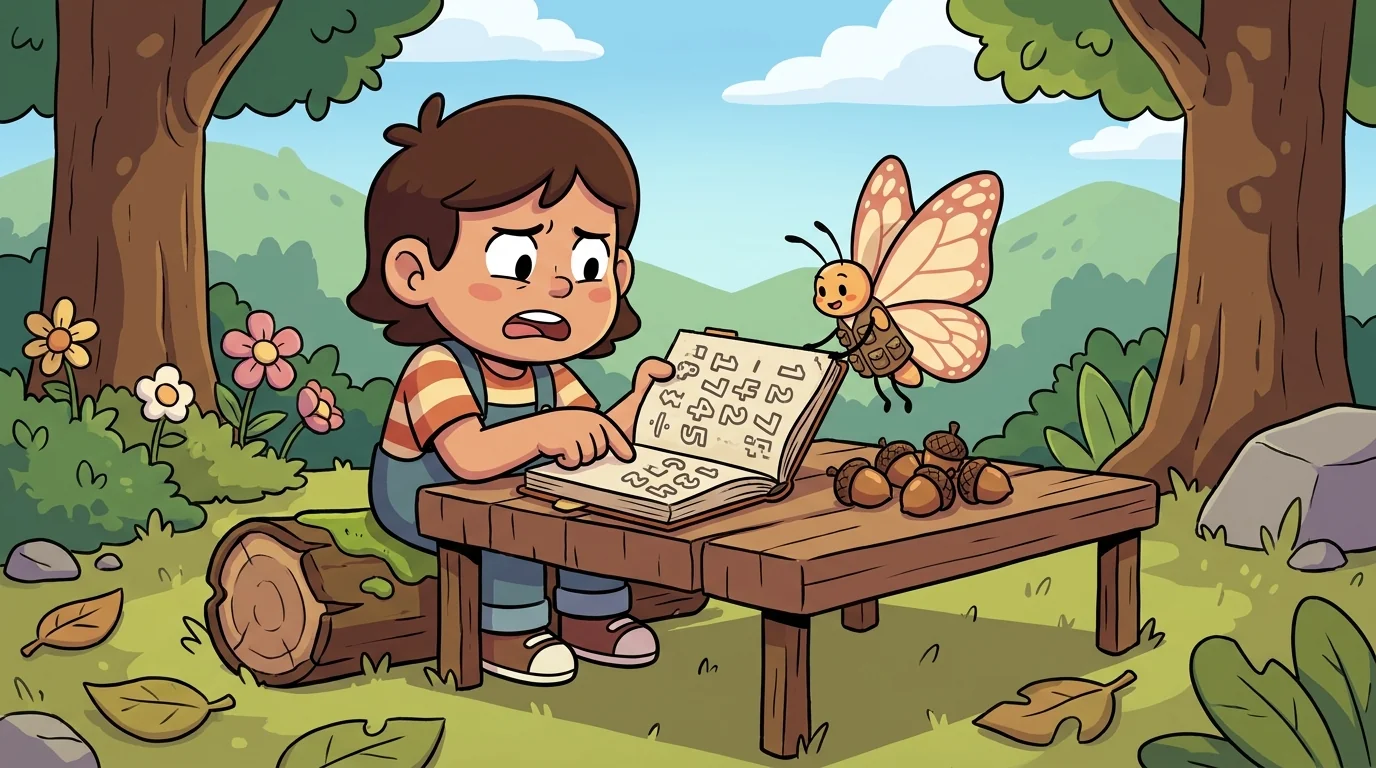
Display hummed a quiet tune, barely audible over the clatter of lunch trays. She sat at her usual corner table, a small island of calm amidst the cafeteria chaos. Her stats-vest, a chunky-cartoon affair with tiny, almost invisible data points stitched into the fabric, seemed to absorb the noise around her, leaving her focused on the task at hand. She held a pencil like a miniature scepter, poised above a sheet of crumpled paper. It was a chunky-cartoon brush-pose, precise and deliberate, as if she were about to paint a masterpiece instead of just sketching out numbers.
Her name was Display, and she was, in her own words, a careful-painter-monarch-tween. She had a way of looking at the world, not just seeing things, but seeing the patterns hidden beneath them. Her skin was the color of warm cream, with soft orange wings that shimmered whenever she leaned forward, which was often. Today, she was deeply attentive to a small pile of graph-cards, each one showing a different way to draw numbers.
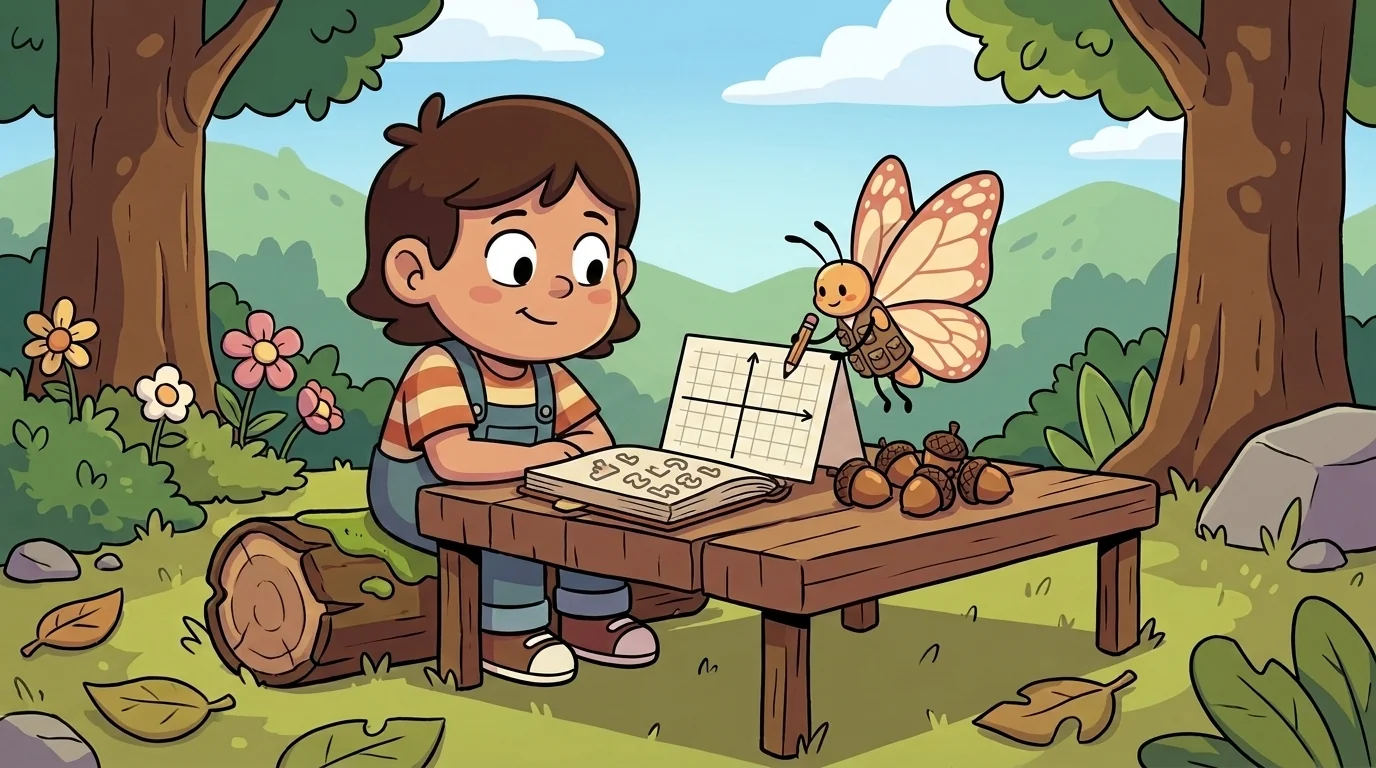
"Look at this," she murmured, pushing the paper towards her friend, Leo. Leo, whose mind usually worked in grand, sweeping theories, squinted at the page. It was covered in a dense block of numbers, a list of daily temperatures from their town over the last three months. "It's… a lot of numbers," he finally said, rubbing his temples. "My brain feels like it's trying to read a phone book."
Display nodded, a knowing glint in her eyes. "Exactly. Numbers are like a secret code. You can stare at them all day and not see what they're trying to tell you." She pulled out her small graph-card-set and her visualization-tracker, a clear plastic ruler with different graph shapes etched into it. "This is where *data visualization* comes in. It's the craft of turning those numbers into pictures. The right picture reveals the pattern."
Leo leaned closer. "So, what's the pattern in these temperatures?"
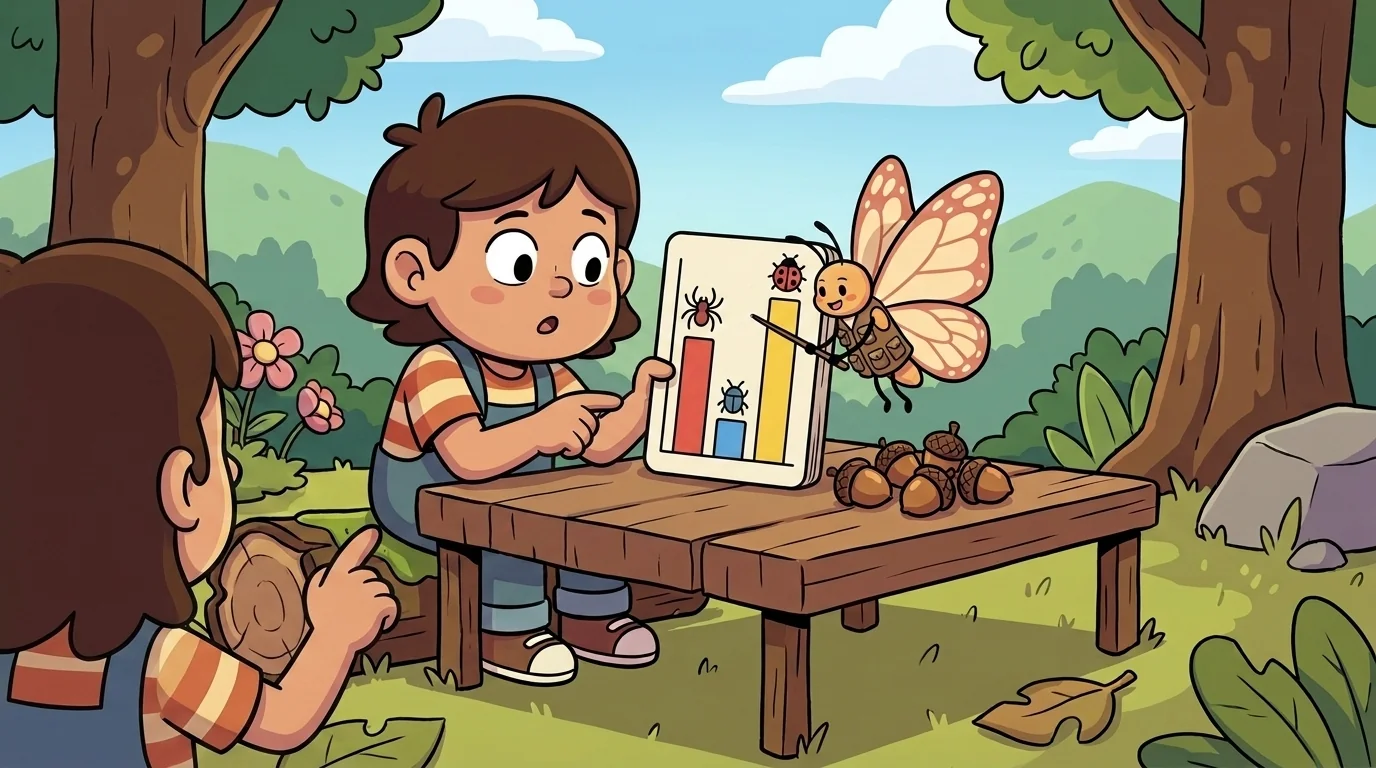
"Well," Display began, picking up a blank card. "If we just want to compare the average temperature each month, a bar chart is perfect." She quickly sketched three thick bars, labeling them "April," "May," and "June," and drawing them to different heights based on the average temperatures. "See? April was cool, May warmed up, and June was hot. Easy to see the comparison, right?"
Leo's eyes widened. "Whoa. Yeah, that's way clearer than all those individual numbers."
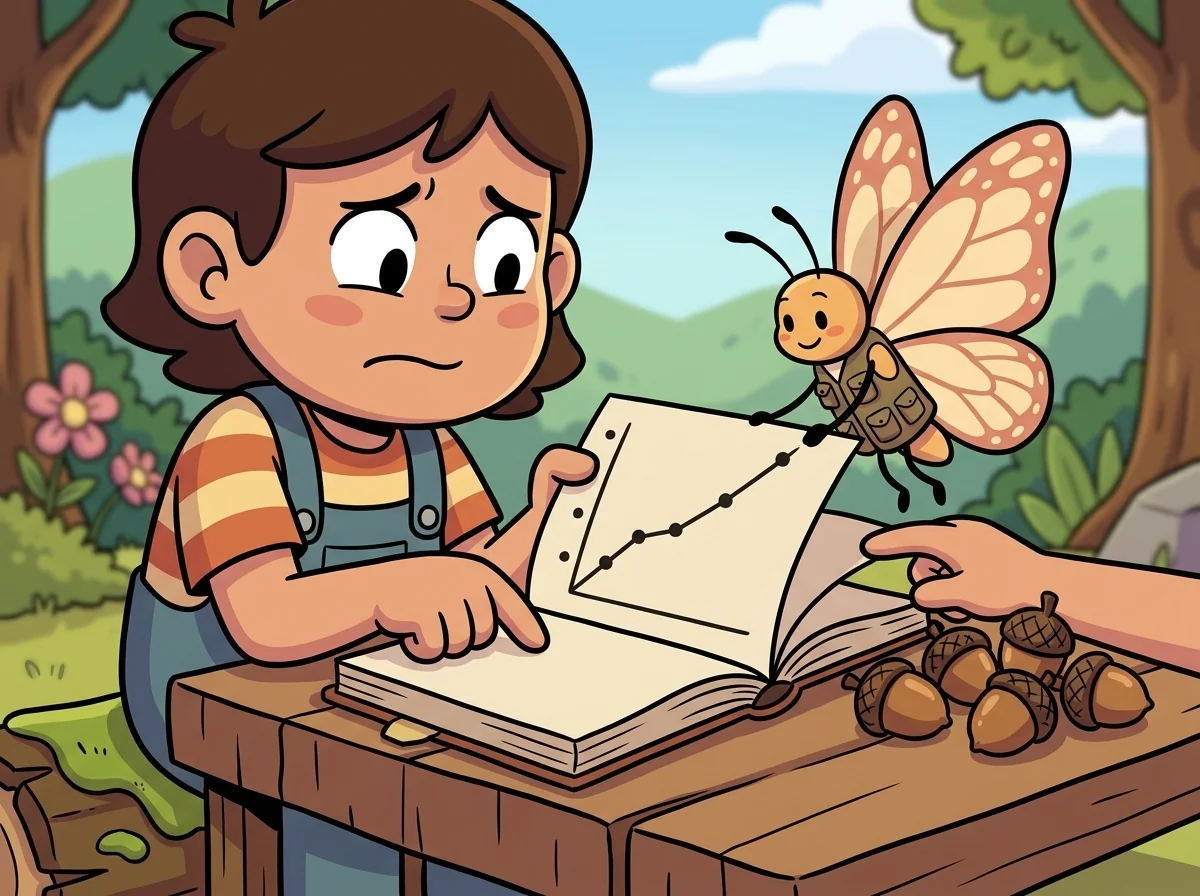
"But what if we want to see how the temperature changed over time?" Display continued, pulling out another card. "A bar chart isn't the best for that. For change over time, we use a line graph." With quick, confident strokes, she plotted each day's temperature as a dot, then connected them with a smooth, flowing line. The line dipped and rose, showing the daily fluctuations, the cold snaps and heat waves. "Now you can see the trend, how it generally got warmer, but also those little ups and downs."
Leo traced the line with his finger. "It's like the story of the weather, day by day."
"Precisely!" Display beamed. "Every graph tells a story, if you choose the right one. The wrong graph hides or distorts it." She paused, then picked up a final card. "What if we wanted to see if there was a connection between the number of hours of sunshine each day and the temperature?"
Leo frowned. "That sounds complicated. How would you even show that?"
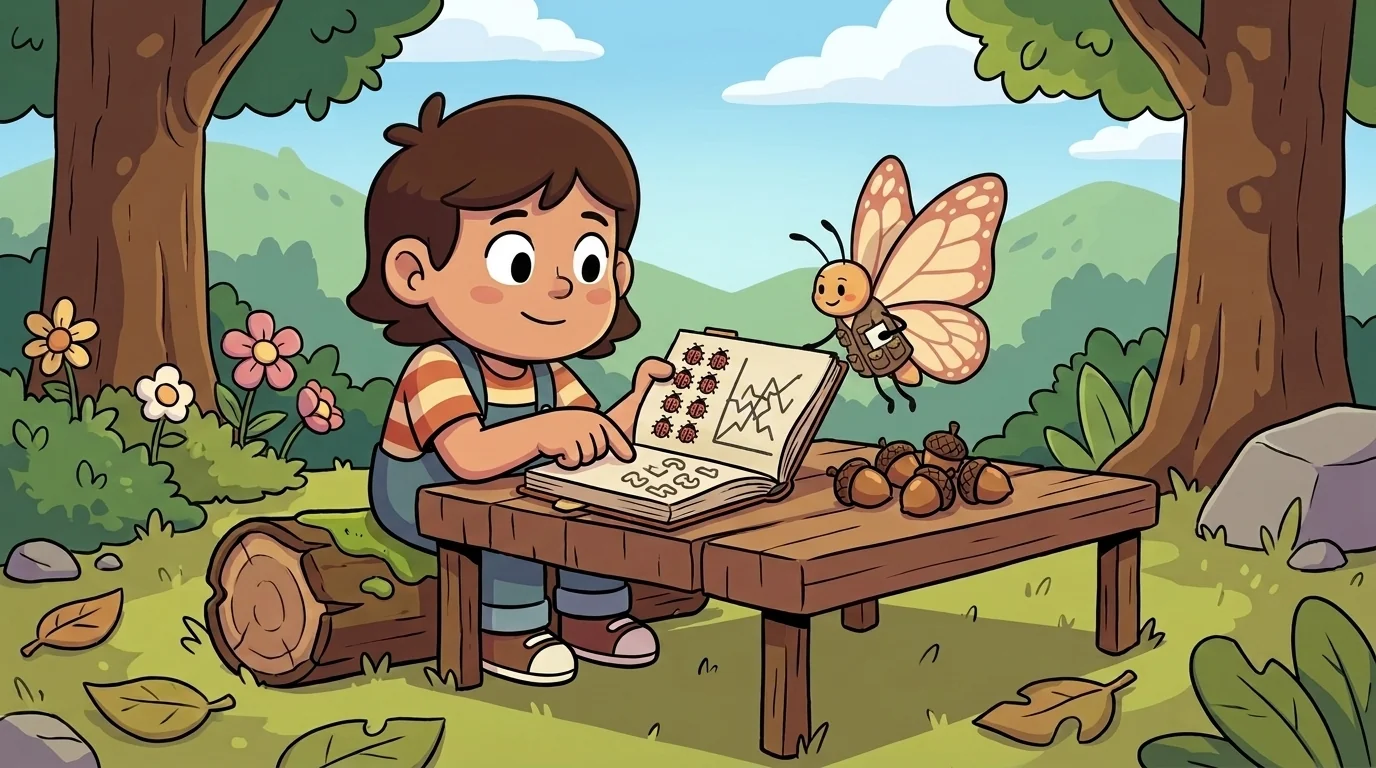
"For two-variable relationships, we use a scatter plot," Display explained, drawing two axes. "One axis for sunshine hours, the other for temperature. Each dot is a day. If the dots mostly go up and to the right, it means more sunshine generally leads to higher temperatures." She quickly dotted the card, and a loose upward trend began to emerge. "It shows a relationship, even if it's not perfectly straight."
Leo whistled softly. "So, you're not just drawing pretty pictures. You're making the numbers talk."
Display carefully put her graph-card-set back into its small pouch. "That's it, exactly. Turn numbers into pictures. The right picture reveals the pattern. It's not about making things look nice, though good graphs often do. It's about clarity. It's about understanding." She looked at the three different graphs, each telling a different part of the temperature story, each making sense of the jumbled data. The cafeteria still buzzed around them, but for Display, the world had just become a little bit clearer, a little bit more understandable.
The ChanceForge ensemble
Display is part of ChanceForge's distributed-narrative cast. Each character embodies a different curricular primitive; together they teach the full subject.
-

Tally the Counter-of-Outcomes
Data collection + frequency counting (the foundational "what happened, how often?" move)
-

Center the Middle-Finder
Central tendency — mean, median, mode (the "what's typical?" question)
-

Sample the Estimator
Sampling, sampling distributions, inference from sample to population
-

Tree the Compound-Brancher
Compound events and probability trees — multiplication rule for independent events, addition for disjoint, conditional dependencies
-

Odds the Likelihood-Reader
Basic probability — placing a chance on the 0-to-1 scale from impossible to certain
-

Scatter the Spread-Reader
Spread and variability — how far apart the data is (range), not just the middle
-

Flipside the Other-Outcome-Counter
The complement rule — find the chance it doesn't happen and subtract from 1
-

Clew the Clue-Follower
Conditional probability — how chances change once you learn a new fact
-
Evens the Long-Run-Settler
Expected value and the long run — results settle toward the average over many tries